
What percentage of global greenhouse gas emissions does South Sudan produce?
South Sudan produces 0.13% of global emissions, and has been ranked the world’s 70th largest emitter of greenhouse gases since 1990. Since this date, their annual emissions have increased by a compound annual growth rate (CAGR) of 1.7%.
Summary – GHG Emissions in South Sudan
| Country | South Sudan |
|---|---|
| Population | 11.4m | Gross Domestic Product (GDP) in USD | $12bn |
| Total Greenhouse Gas Emissions in 2019 | 60.3m |
| Change in Emissions since 2018 | -10.2% |
| Percentage of Total Emissions (2019) | 0.13% |
| Rank – Emitters in 2019 | 77 |
| Total Greenhouse Gas Emissions since 1990 | 1.83bn |
| Compound Annual Growth – Emissions since 1990 | 1.7% |
| Percentage of Total Emissions (1990-2019) | 0.16% | GDP Per Capita (USD) | $1.05k |
| Emissions Per Capita | 5.3 |
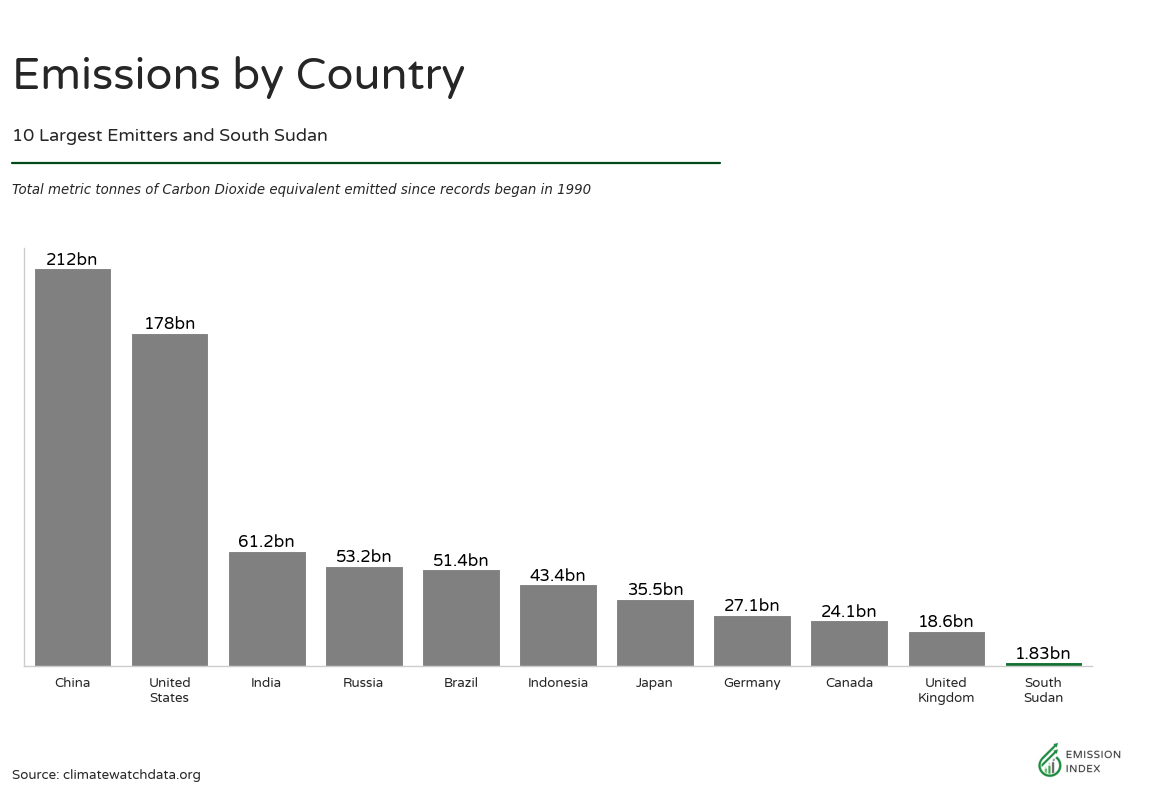
In the last recorded year (2019), South Sudan was the world’s 77th largest producer of yearly carbon dioxide emissions and contributed 0.13% of all global emissions. The top three emitters in the same period were China, the United States, and India. These three nations produced 25.2%, 12%, and 7% of global emissions respectively.
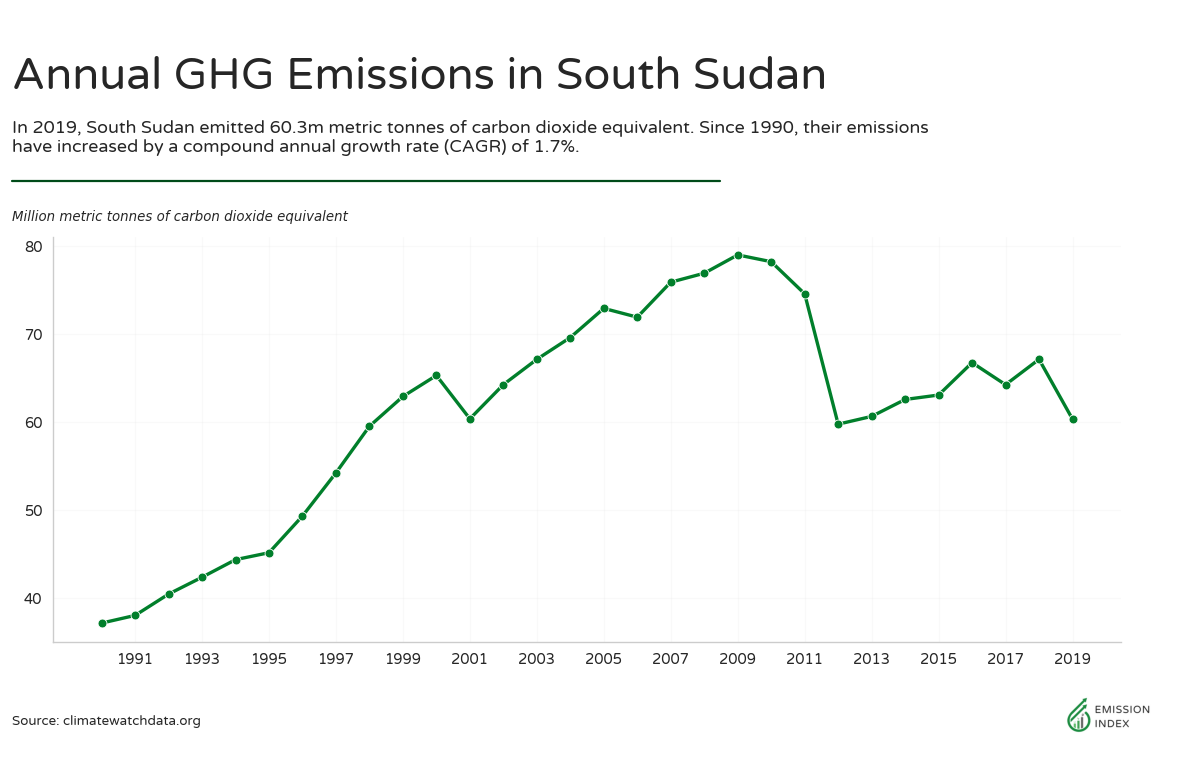
In 2019, South Sudan emitted 60.3m metric tonnes of carbon dioxide equivalent, or MtCO₂e. This represented a decrease in emissions from 2018 by -10.2%.
Emissions per capita in South Sudan – average household carbon footprint
The population of South Sudan is 11.4m. On a per capita basis, they produce 5.3 tonnes of carbon dioxide equivalent (tCO2e) per person. This places them 93rd out of 191 on emissions produced per capita. The top three emitters per capita are Solomon Islands, Qatar, and Kuwait.
What is the largest source of greenhouse gas emissions in South Sudan?
In 2019, South Sudan produced 50.9m metric tonnes of greenhouse gas emissions. This was a reduction of -11.2% from 2018. 3.3% of these emissions came from CO2, 59.3% came from CH4, and 37.2% came from N2O.
The sector that produced the most emissions in 2019 was the agriculture industry. Agriculture produced 42.4m of greenhouse gas (GHG) emissions. This amounted to 83.2% of total GHG in South Sudan. The second and third largest emitting sectors were land-use change and forestry and energy- producing 18.5% and 11.4% of total GHG respectively.
Energy
The industry that produced the most energy related emissions was the fugitive emissions sector, emitting 4.06m tonnes of greenhouse gas. The second and third largest emitting sectors were transportation and electricity/heat – producing 849k and 717k tonnes of GHG each.
Land Use Change and Forestry
Land use change and forestry (LUCF), such as deforestation and conversion of natural ecosystems to agricultural or urban areas, can have a significant impact on carbon emissions.
- Trees and other vegetation absorb and store carbon through the process of photosynthesis, and when they are cut down or burned, that stored carbon is released into the atmosphere.
- Deforestation and other forms of land use change can also reduce the ability of ecosystems to absorb and store carbon in the future. Additionally, the conversion of land for agriculture or urban development can lead to the release of carbon stored in the soil.
- On the other hand, sustainable forestry practices, such as reforestation and afforestation, can help to remove carbon from the atmosphere and store it in trees and other vegetation.
In the case of South Sudan, their LUCF had a negative impact on their emissions, increasing their footprint by 9.42m tonnes.
After accounting for land use change and forestry, the total amount of greenhouse emissions in South Sudan in 2019 was 60.3m metric tonnes.
Is there a correlation between greenhouse gas emissions and economic growth?
In 2019, gross domestic product (GDP) in South Sudan did not change from the previous year. Measured in US dollars, the economy went from $nan to $nan. In the same period carbon emissions decreased by -10.2%. Over a ten year period from 2009 to 2019, GDP did not change, while emissions have decreased by -23.7%.
To put this into context, the compound annual growth rate of GDP in South Sudan over the previous ten years was 0% and the CAGR for greenhouse gas emissions was -2.7%.