

What percentage of global greenhouse gas emissions does Lesotho produce?
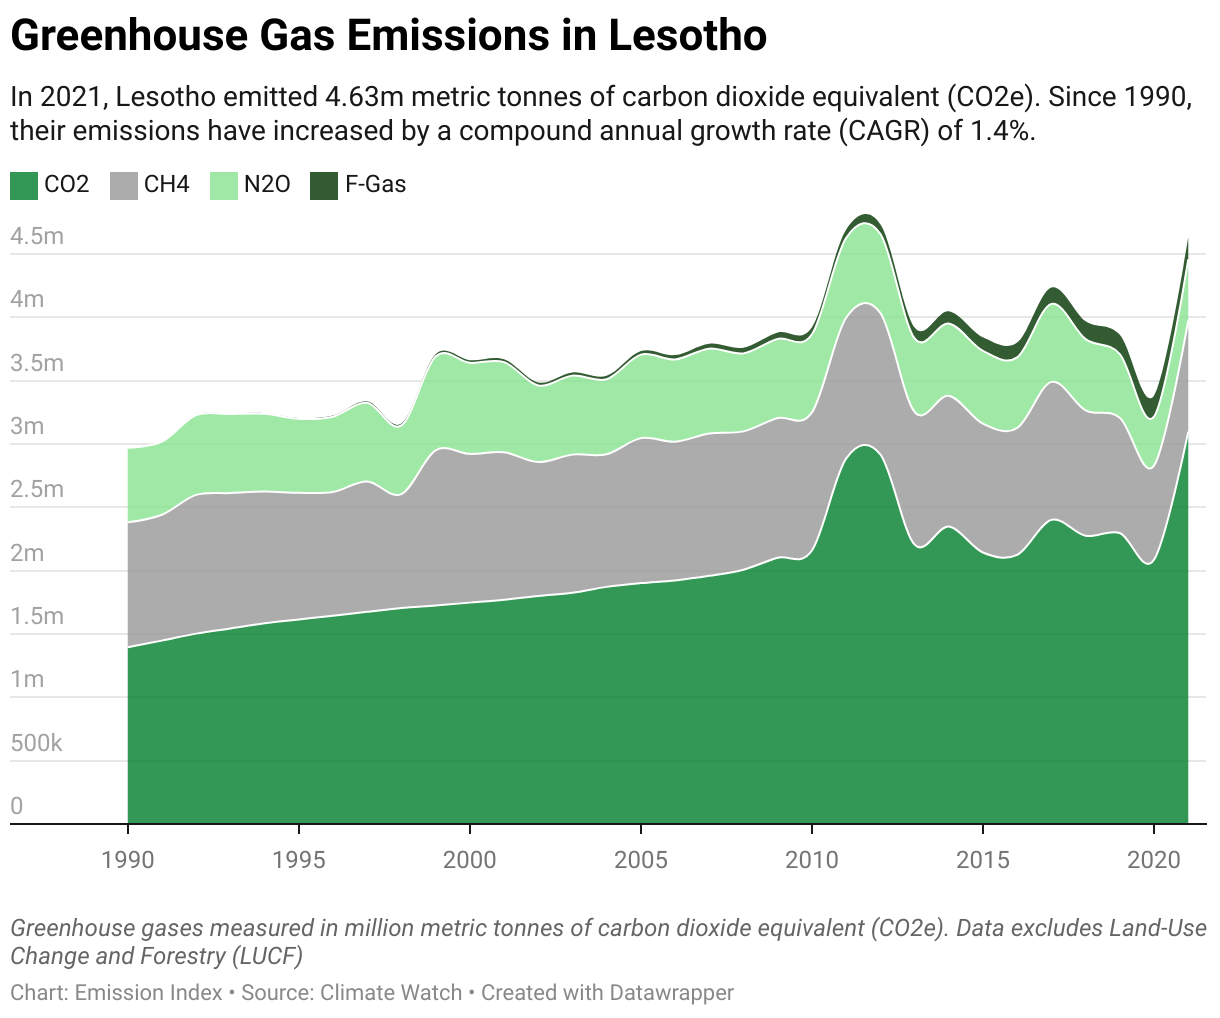
Lesotho produced 0.01% of global greenhouse gas emissions in 2021 (the latest date with complete emissions data). This amounted to 4.63m metric tonnes of carbon dioxide equivalent, or MtCO₂e. These emissions represented an increase from 2020 by 37%.
In the period from 1990 to 2021 their emissions have increased by a compound annual growth rate (CAGR) of 1.4% and Lesotho has contributed 0.01% of global greenhouse emissions.
| Country | Lesotho |
|---|---|
| Population | 2.16m | Gross Domestic Product (GDP) in USD | $2.52bn |
| Total Greenhouse Gas Emissions in 2021 | 4.63m |
| Change in Emissions since 2020 | 37% |
| Percentage of Total Emissions (2021) | 0.01% |
| Rank – Emitters in 2021 | 153 |
| Total Greenhouse Gas Emissions since 1990 | 118m |
| Compound Annual Growth – Emissions since 1990 | 1.4% |
| Percentage of Total Emissions (1990-2021) | 0.01% | GDP Per Capita (USD) | $1.17k |
| Emissions Per Capita | 2.1 |
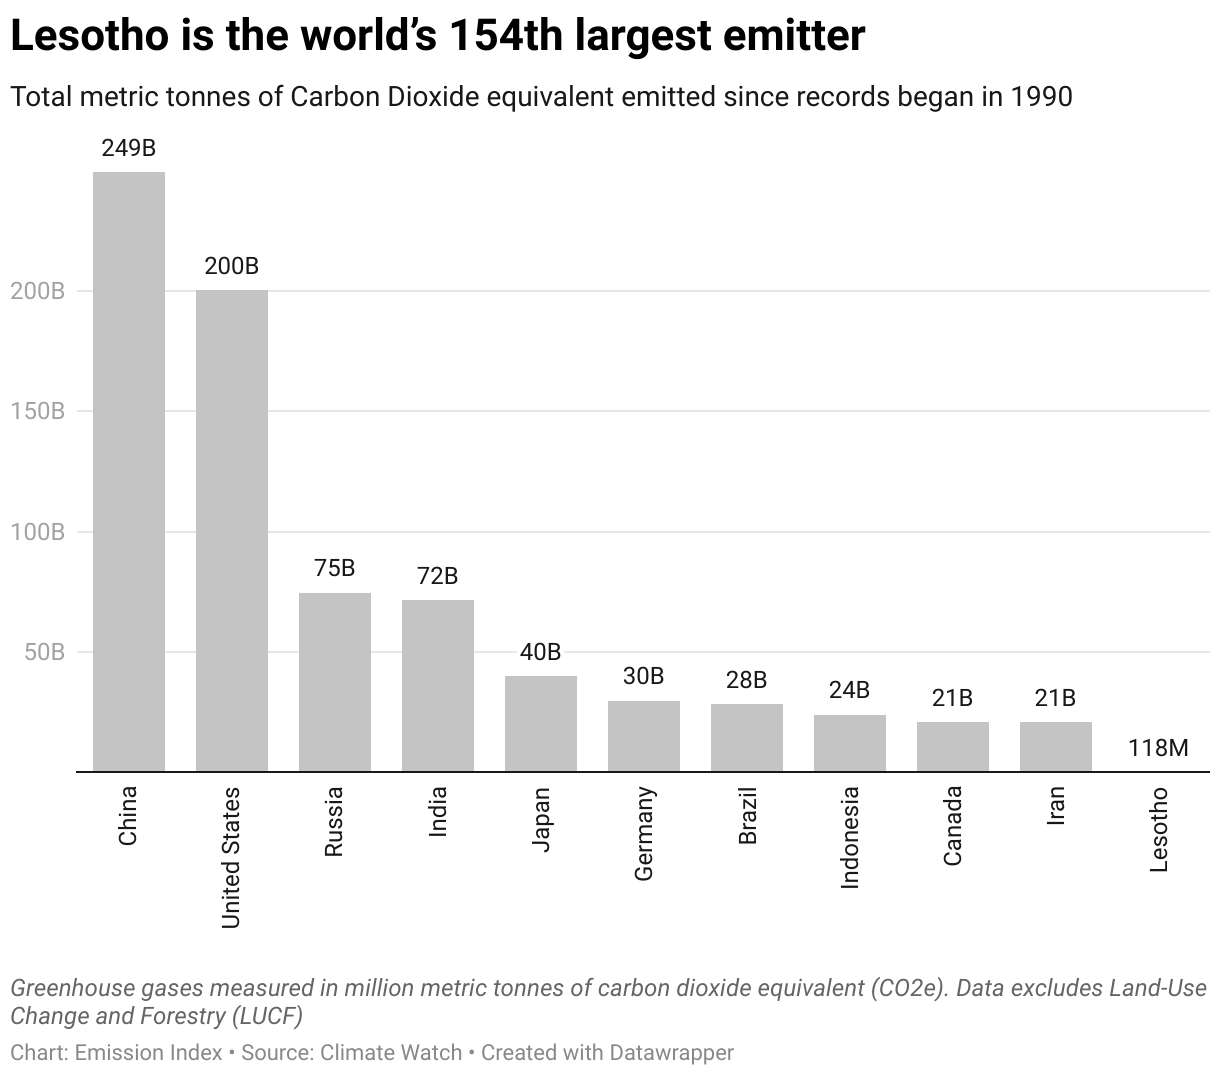
In 2021, Lesotho was the world’s 153rd largest producer of greenhouse gas emissions. The largest emitters in the same period were China, the United States, India, Russia and Brazil.
When looking at emissions over time Lesotho is the 154th largest emitter since 1990.
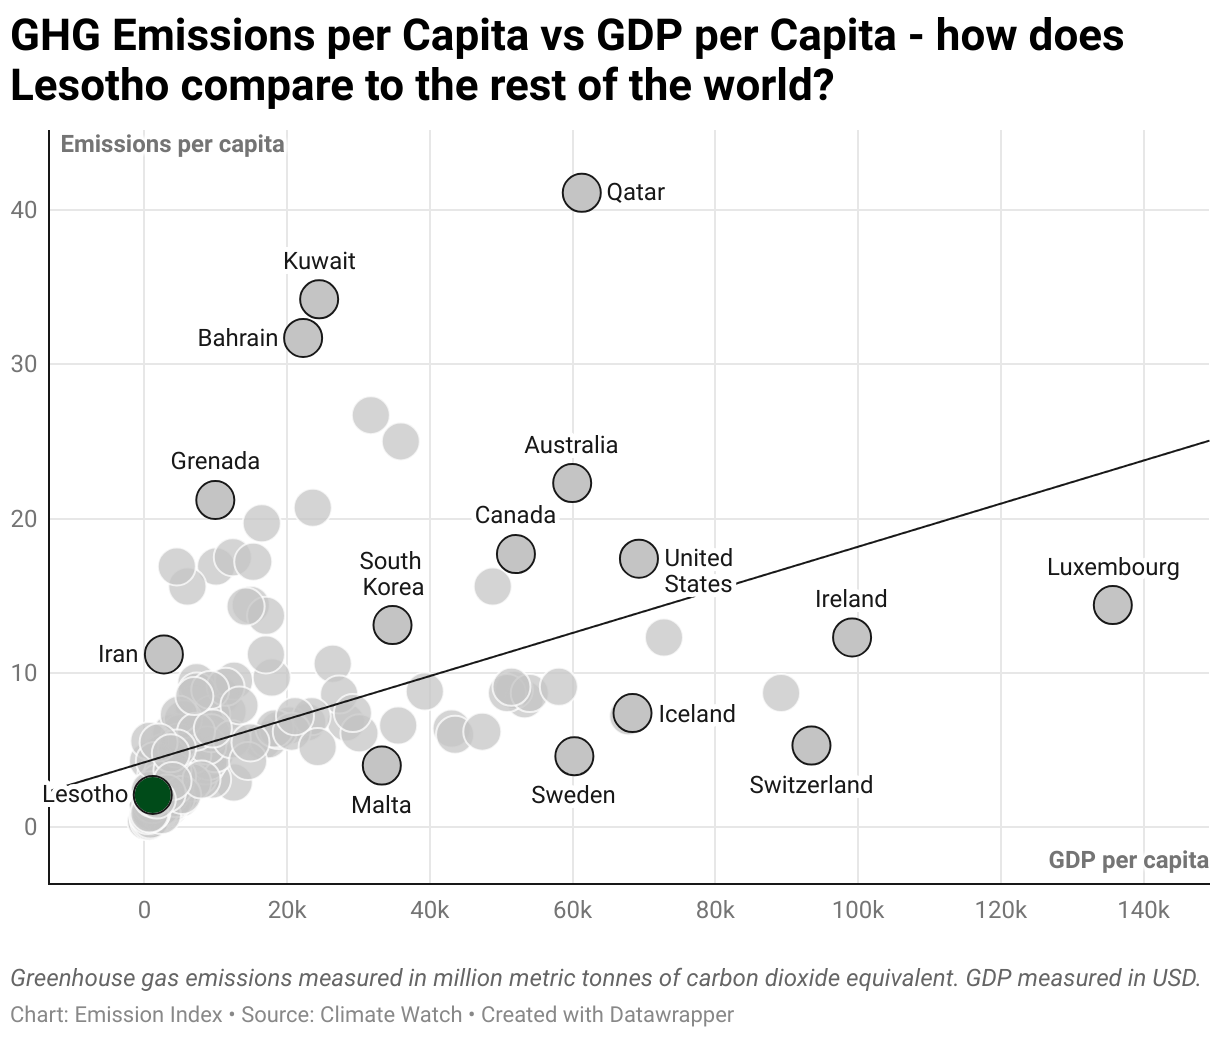
Emissions per capita in Lesotho – average household carbon footprint
The population of Lesotho is 2.16m. On a per capita basis, they produce 2.1 tonnes of CO2e per person, placing them 146th out of 191 on emissions produced per capita. The biggest per capita emitters are Qatar, Kuwait, Bahrain and Turkmenistan.
What is the largest source of greenhouse gas emissions in Lesotho?
Gases
66.9% of emissions in Lesotho came from Carbon Dioxide (CO2), 19% came from Methane (CH4), and 10.4% came from Nitrous Oxide (N2O).
Sectors
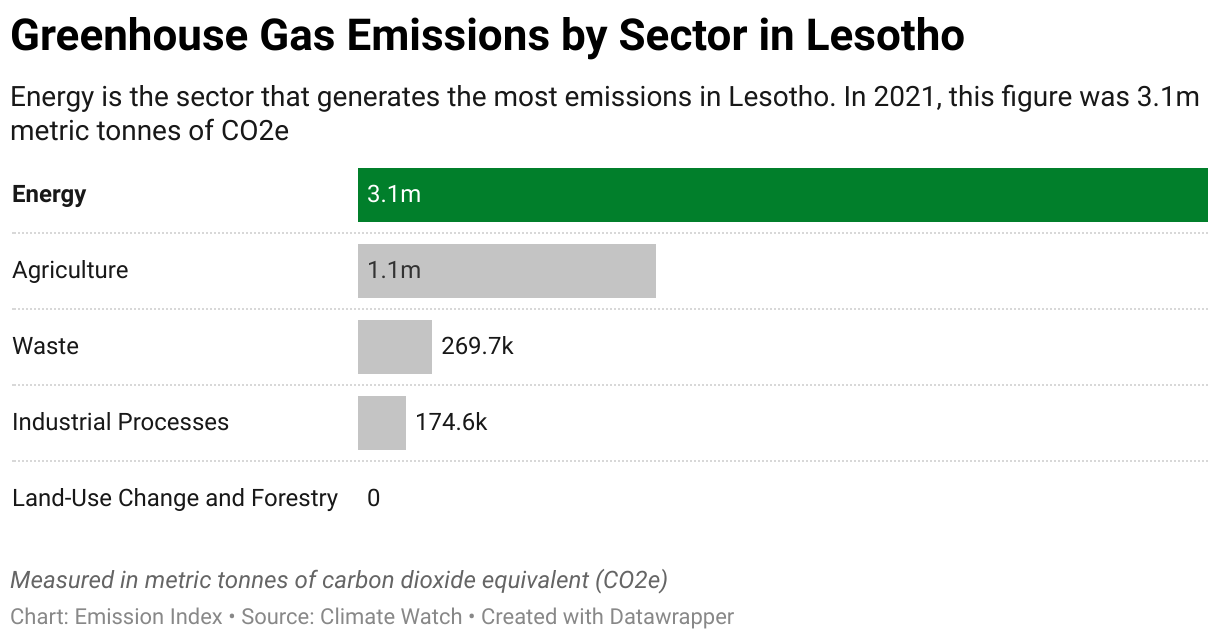
The sector that produced the most emissions in 2021 was the energy industry, producing 3.1m of GHG emissions, constituting 66.9% of total.
The second and third largest emitting sectors were agriculture and waste, producing 23.5% and 5.8% of total GHG in Lesotho.
Energy
The industry that produced the most energy related emissions was the manufacturing/construction industry, producing 2.5m of GHG emissions, constituting 54.1% of total emissions.
The second and third largest emitting sectors were transportation and building, emitting 422k and 167k tonnes of GHG each.
Land Use Change and Forestry
Land use change and forestry (LUCF), such as deforestation and conversion of natural ecosystems to agricultural or urban areas, can have a significant impact on carbon emissions.
- Trees and other vegetation absorb and store carbon through the process of photosynthesis, and when they are cut down or burned, that stored carbon is released into the atmosphere.
- Deforestation and other forms of land use change can also reduce the ability of ecosystems to absorb and store carbon in the future. Additionally, the conversion of land for agriculture or urban development can lead to the release of carbon stored in the soil.
- On the other hand, sustainable forestry practices, such as reforestation and afforestation, can help to remove carbon from the atmosphere and store it in trees and other vegetation.
In the case of Lesotho, LUCF had no impact on Lesotho’s emissions, decreasing their carbon footprint by 0 tonnes.
After accounting for land use change and forestry, the total amount of greenhouse gas emissions in Lesotho in 2021 was 4.63m metric tonnes.
How vulnerable is Lesotho to the impact of climate change?
The Notre Dame Global Adaptation Initiative (ND-GAIN) Index
The ND-GAIN Index measures countries’ vulnerability to global challenges, including climate change, and their readiness to improve resilience.
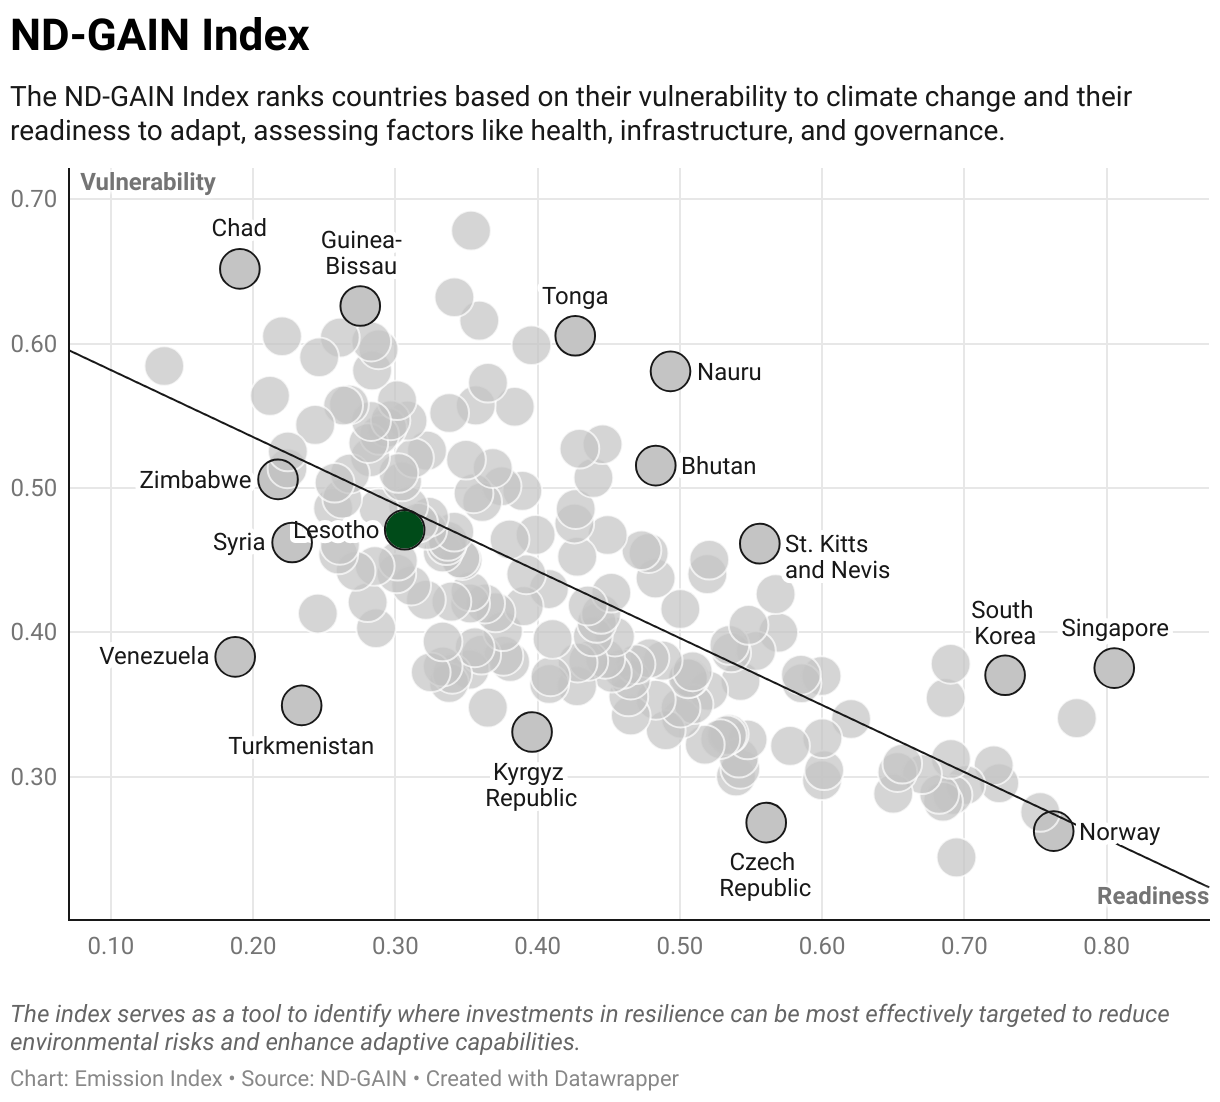
Lesotho scores 41.8 on the ND-Gain Index and is classified in the
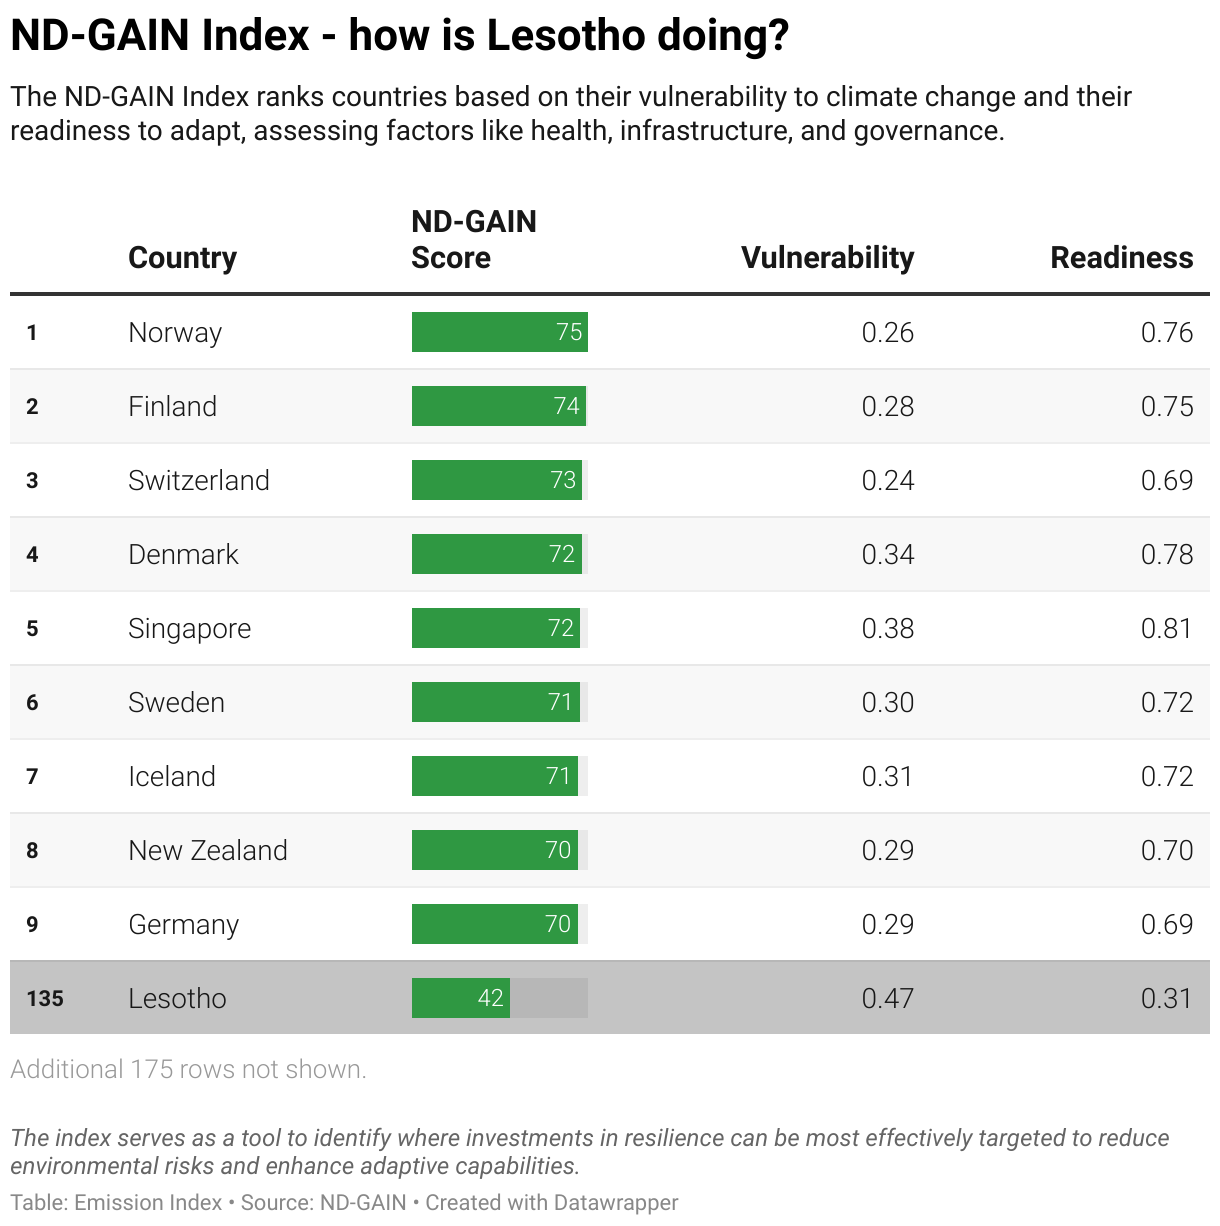
The index aims to assist businesses, governments, and communities in prioritising investments for a more efficient response to global shifts.
It is measured by combining two main components:
- Vulnerability: This evaluates a country’s vulnerability to environmental risks and its ability to adapt. It considers health, food and water availability, infrastructure, and ecosystem services. A higher score indicates greater vulnerability to environmental challenges.
- Readiness: This measures how well a country can leverage investments to mitigate climate change. It considers economic stability, governance, technology, and infrastructure. A higher score means a country is better prepared to implement resilience strategies.
This ranking helps identify areas where resources and adaptation strategies can be most effectively directed to mitigate risks and enhance resilience.
By combining these dimensions, the index provides a comprehensive approach to measuring countries’ ability to cope with the impacts of climate change.
High vulnerability and low readiness in Lesotho
In terms of readiness to adapt to climate change, Lesotho ranks in the bottom 25% group. Globally, the average readiness score is 0.424, with Lesotho posting a score of 0.307.
They show the greatest strength in governance aspects, while their performance in social aspects requires improvement.
- Governance readiness refers to the political, legal, and regulatory aspects influencing a country’s adaptation to climate change, including stability, corruption control, and law enforcement.
- Social readiness refers to the societal factors like inequality, education, and technology infrastructure that affect a country’s ability to adapt to and mitigate the impacts of climate change.
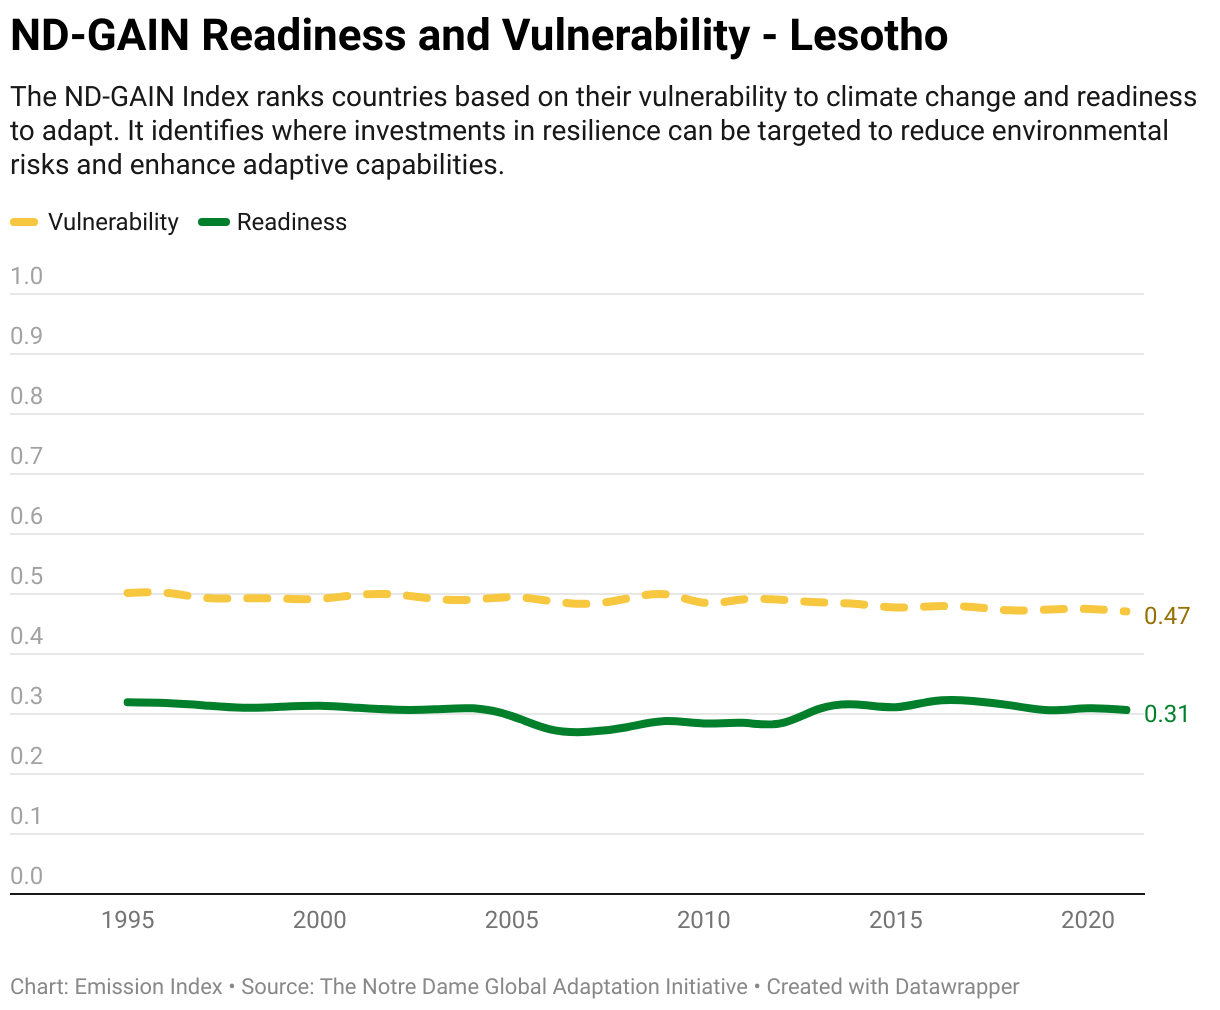
Regarding vulnerability to climate change, Lesotho falls into the above average category. Compared to the global average vulnerability score of 0.431, Lesotho has a score of 0.471.
Their resilience is most notable in water areas, yet they face significant challenges in health.
- Water vulnerability refers to the availability and reliability of water resources, critical for economies and livelihoods. Efficient water use and resilient systems are essential as climate change affects precipitation patterns.
- Health vulnerability refers to the impact of climate change on diseases and medical resources. Innovations can enhance resilience to vulnerabilities affecting human health through food, water insecurity, and extreme weather events.
The formula to calculate the ND-GAIN Index is
GAIN Index=(Readiness Indicators−Vulnerability Indicators+1)×50GAIN Index=(Readiness Indicators−Vulnerability Indicators+1)×50
In this formula:
- The Readiness Indicators are measured on a scale of 0 to 1, where a higher score means that the readiness is better.
- The Vulnerability Indicators are also measured on a scale of 0 to 1, but a lower score indicates better vulnerability in this case.
- The difference between the Readiness and Vulnerability scores is calculated and then incremented by 1.
- Finally, the result is multiplied by 50 to convert the GAIN Index score to a range of 0-100, where a higher score means the situation is better.
Is there a correlation between greenhouse gas emissions and economic growth in Lesotho?
In 2021, the gross domestic product (GDP) in Lesotho grew by 13.6% from the previous year, with the economy moving from $2.07bn to $2.35bn. During the same period, carbon emissions increased by 37%. Over the ten-year period from 2011 to 2021, GDP declined -8.9%, while emissions decreased by -1.3%.
To put this into context, the compound annual growth rate (CAGR) of GDP in Lesotho over the past ten years was -0.93%, and the CAGR for greenhouse gas emissions was -0.13%.